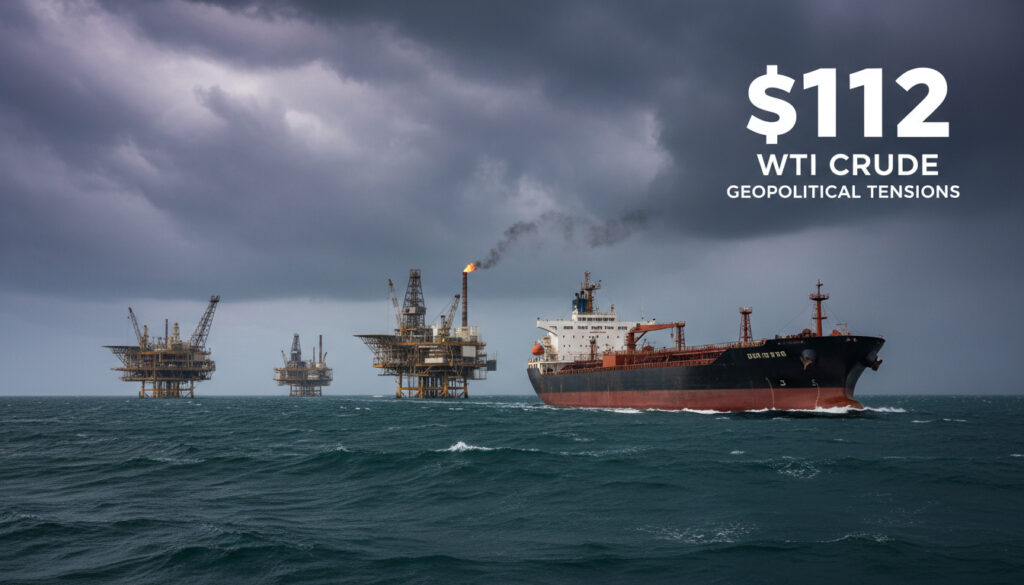
Crude Oil Prices Today – WTI Surges to $112 on Gulf Tensions
WTI crude oil futures surged to levels unseen since June 2022, trading between $111.54 and $112.06 per barrel amid sharp geopolitical disruptions in the Middle East. Brent crude benchmarks fluctuated between $109.03 and $118.35 as markets priced in actual supply threats rather than speculative risks.
The rally follows recent attacks on energy infrastructure in the Persian Gulf, including the strike on the Kuwaiti tanker Al-Salmi near Dubai. U.S.-Iran tensions have introduced significant volatility, with prices swinging from highs near $112 to lows around $100 within sessions as de-escalation signals emerged from Washington.
What is the Price of Crude Oil Today?
Current trading sessions reveal significant divergence between spot and futures pricing across major benchmarks. The following overview captures real-time market snapshots.
Key Market Insights
- WTI reached its highest level since June 2022, breaking above $111 per barrel
- Geopolitical risk premiums now reflect actual supply disruptions rather than hypothetical threats
- Futures markets display steep backwardation, with December 2028 contracts trading at $65.90
- WTI Midland commands a significant premium at $119.32, up 12.51% from previous sessions
- Data discrepancies persist across platforms due to 2–4 day reporting delays and session timing differences
- Recent EIA inventory data triggered short-term price rebounds despite broader bearish trends
- RBOB Gasoline trades at $3.31 while Natural Gas hovers near $2.80, reflecting product market softness
Comprehensive Price Snapshot
| Benchmark | Price (USD) | Change | Notes |
|---|---|---|---|
| WTI Futures (Nearby) | $111.54 | +11.41% | 2 days delay |
| WTI Futures (Alt Quote) | $112.06 | Flat | Previous close |
| WTI (March 31, 5:00 PM) | $101.52 | -1.32% | Session close |
| Brent Crude (2-day delay) | $109.03 | +7.78% | ICE Futures |
| Brent (March 31, 2:54 PM) | $118.35 | +3.46% | Intraday high |
| OPEC Basket | $110.63 | -10.21% | 4 days delay |
| Murban Crude | $114.84 | +10.82% | ADNOC benchmark |
| WTI Spot (Cushing) | $96.60 | -1.29% | Physical delivery |
| WTI Midland | $119.32 | +12.51% | Permian benchmark |
| RBOB Gasoline | $3.31 | -1.17% | Refined product |
| Natural Gas | $2.80 | -0.67% | Henry Hub |
Why Are Crude Oil Prices Changing Today?
Multiple converging factors drive current volatility, shifting market sentiment within hours. Supply disruptions in the Persian Gulf dominate pricing mechanisms, though technical trading patterns and inventory data contribute to intraday movements.
Geopolitical Tensions in the Gulf
Iran’s attack on the Kuwaiti tanker Al-Salmi near Dubai marked an escalation in regional conflict, with repeated strikes targeting energy infrastructure throughout the Gulf. U.S. President Trump subsequently signaled potential de-escalation, suspending offensive operations and indicating willingness to end military campaigns even if the Strait of Hormuz remains closed, provided Iran’s navy and missile capabilities are neutralized. This rhetoric aided potential tanker restarts from GCC producers, though physical risks persist.
Iranian leadership expressed openness to ending hostilities under specific conditions, rhetoric that trimmed prices from $107 peaks toward the $100–$104 range. Markets now price tangible supply disruptions rather than speculative threats, according to Trading Economics.
Supply Disruption Realities
Physical flows face genuine constraints. GCC tanker operations partially halted during peak tensions, with restartability contingent upon sustained diplomatic progress. The Strait of Hormuz remains a chokepoint risk, with approximately one-fifth of global oil shipments traversing the waterway. OilPrice.com data indicates the rally accelerated as markets incorporated actual Gulf disruptions into spot pricing.
Prices have swung from $112 highs to $100 lows within recent sessions as diplomatic rhetoric shifts. Real-time trading reflects Sunday market closures, creating potential gaps in spot pricing visible across electronic platforms.
Technical Trading Patterns
Despite the headline rally, technical analysts maintain bearish strategies, targeting sell rebounds toward the 58–56 range from current 61 levels. Short-term bounces emerged following EIA inventory releases, though the broader daily trend remains pressured. TradingView technical data suggests no reversal in sales momentum despite recent gains.
What is the Oil Price Per Barrel Right Now?
Physical barrel pricing varies significantly by location, quality, and delivery timing. Understanding these differentials proves essential for accurate market assessment.
Benchmark Variations
WTI Cushing spot prices, tracked by the U.S. Energy Information Administration, diverge from futures quotes due to delivery logistics and timing. Recent WTI spot prices registered $96.60, down 1.29%, while futures contracts trade at premiums exceeding $111. Brent crude, representing seaborne North Sea production, currently trades between $109.03 and $118.35 depending on session timing and exchange.
Investors monitoring these differentials might compare energy sector financial services, such as Members First Credit Union – NH Eligibility Services and Rates, when evaluating portfolio allocation strategies amid commodity volatility.
Grade Differentials
Quality variations create substantial price spreads. WTI Midland, representing Permian Basin production with superior logistics to Gulf Coast refiners, commands $119.32 per barrel, up 12.51%. Murban crude, the UAE export grade, trades at $114.84. These premiums reflect API gravity, sulfur content, and proximity to refining centers rather than inherent crude value alone.
When futures prices trade below spot prices, markets signal expectations of temporary supply constraints. The current spread between $112 spot and $65.90 for December 2028 suggests traders view current disruptions as short-term rather than structural.
Unit Conversions
Based on current WTI ranges between $101 and $112 per barrel, standard conversions yield approximately $0.66 per liter, $2.50 per gallon, or $772.57 per metric tonne, according to Markets Insider calculations.
Crude Oil Price Chart and Recent Trends
Historical data reveals a sharp upward trajectory over the past week, with prices climbing from the $88 range to above $105 before extending toward current $111+ levels.
Seven-Day Trading History
Daily closes demonstrate accelerating momentum punctuated by volatility:
| Date | Open | Close | High | Low |
|---|---|---|---|---|
| March 30, 2026 | 102.50 | 104.99 | 105.39 | 99.25 |
| March 27, 2026 | 93.40 | 101.38 | 101.38 | 92.09 |
| March 26, 2026 | 91.35 | 93.75 | 95.47 | 89.79 |
| March 25, 2026 | 88.49 | 91.31 | 91.60 | 86.46 |
| March 24, 2026 | 88.94 | 88.49 | 93.36 | 86.40 |
Futures Curve Structure
The forward curve indicates significant contango expectations beyond 2026. Investing.com data shows progressive declines in later contracts: August 2026 at $81.61, September 2026 at $77.98, and December 2028 at $65.90. This structure implies market expectations of resolved geopolitical tensions or demand destruction within two to three years.
2027 contracts trade around $67–$70, while 2028–2029 deliveries settle between $65.90–$66.30. These levels suggest markets anticipate crude returning to pre-crisis pricing bands once Gulf stability resumes.
How Have Crude Oil Prices Moved Recently?
Chronological analysis of the past week’s trading sessions reveals distinct phases: consolidation, breakout, and geopolitical premium expansion.
- March 24: WTI opens at $88.94 but closes lower at $88.49, establishing a floor near $86.40.
- March 25: Initial rally takes hold with a close of $91.31, testing resistance at $91.60.
- March 26: Momentum builds toward $93.75, with intraday peaks reaching $95.47.
- March 27: Breakout acceleration pushes closes to $101.38, recovering from session lows of $92.09.
- March 30: Surge extends to $104.99 close, with intraday highs touching $105.39 before profit-taking.
- Current Session: Gap higher opens above $111, with immediate resistance near $112.06.
What is Certain About Current Oil Prices?
Distinguishing verified market data from speculative projections helps ground investment decisions amid conflicting signals.
| Established Information | Uncertain Factors |
|---|---|
| WTI futures trading between $111.54–$112.06 | Duration of Strait of Hormuz closure risks |
| Iran attacked Kuwaiti tanker Al-Salmi near Dubai | Iranian production response to de-escalation offers |
| Futures curve shows steep backwardation through 2028 | Long-term demand destruction extent in global markets |
| EIA inventory data triggered measurable price rebounds | OPEC production policy adjustments pending |
| WTI Midland trades at $119.32 premium to Cushing spot | Trump administration ultimate strategic objectives |
| Data delays of 2–4 days persist across major platforms | GCC tanker restart timing and capacity |
Why Do Today’s Crude Oil Prices Matter?
Current price levels directly impact refined product costs, with RBOB Gasoline trading near $3.31 and Natural Gas at $2.80. Transportation and manufacturing sectors face immediate margin pressure from $110+ crude, while energy-dependent economies confront inflationary headwinds. The divergence between spot prices above $111 and 2028 futures below $66 suggests market participants view current disruptions as temporary, though physical buyers must secure supplies at elevated spot rates regardless of long-term expectations.
Regional benchmarks including the OPEC Basket at $110.63 and Murban at $114.84 indicate the global nature of the supply crunch, affecting Asian refiners dependent on Middle Eastern exports disproportionately compared to North American markets accessing Permian production.
What Are Analysts Saying About Oil Markets?
Institutional commentary emphasizes the shift from theoretical risk to physical disruption pricing.
Geopolitical tensions dominate, pricing in actual supply disruptions over threats. The market has moved from pricing possibility to pricing reality in the Persian Gulf.
— Trading Economics Market Analysis
The oil rally accelerates as markets factor real disruptions in the Gulf, with Hormuz risks now embedded in spot premiums rather than tail-risk scenarios.
— OilPrice.com Technical Desk
Bearish strategy persists—sell rebounds targeting 58–56 from 61, despite short-term EIA-driven bounce. No reversal expected in sales momentum despite recent rally.
— TradingView Technical Analysts
What Should Investors Watch Next?
Market participants should monitor diplomatic developments regarding the Strait of Hormuz, weekly EIA inventory reports for Cushing storage levels, and the evolving structure of the futures curve for signs of backwardation easing. Just as medical conditions like What Is Spinal Stenosis – Symptoms, Causes and Treatments require careful diagnosis, oil markets demand precise analysis of multiple indicators. The spread between WTI Midland and Cushing spot prices offers additional insight into Permian Basin logistical constraints, while OPEC Basket movements signal broader cartel production stability.
Frequently Asked Questions
What is the difference between WTI and Brent crude oil?
WTI (West Texas Intermediate) trades as a futures contract based on Cushing, Oklahoma delivery, while Brent represents seaborne North Sea production. WTI typically trades at premiums or discounts to Brent based on logistics, quality, and local supply constraints. Currently, WTI futures exceed $111 while Brent fluctuates between $109–$118.
Why are there different prices for the same crude oil benchmark?
Price discrepancies stem from reporting delays (2–4 days across platforms), session timing differences, and contract specifications. Spot prices for physical delivery diverge from futures quotes, as seen in WTI spot at $96.60 versus futures at $111.54.
What is the OPEC Basket price?
The OPEC Basket represents a weighted average of prices for crude oil blends produced by member countries. Currently trading at $110.63, down 10.21% over recent sessions, it serves as a reference for official selling prices to global markets.
How do geopolitical events affect crude oil prices?
Geopolitical events impact prices by threatening physical supply flows. Recent Iran attacks on Kuwaiti tankers and Gulf infrastructure drove WTI up 11.41%, as markets incorporated actual disruption risks rather than speculative threats.
What does the futures curve indicate about future oil prices?
The futures curve shows backwardation, with prices declining from $112 spot to $65.90 by December 2028. This structure suggests traders expect current supply disruptions to resolve, with long-term prices falling toward $66–$70 ranges.
Why is WTI Midland priced higher than standard WTI?
WTI Midland commands a $119.32 premium due to superior logistics connecting Permian Basin production to Gulf Coast refiners and export terminals. Quality specifications and reduced transportation costs relative to Cushing delivery drive the $7+ differential.
More related posts
 Dragon’ Dogma 2 Cla e : Be t Vocation & Unlock
 BigXthaPlug Age: Real Name, Birthday, and Career Facts
 What Time Does Walmart Pharmacy Close? Hours & Policies Explained
 How Tall Is Joe Rogan? Height Debate, Wife, TRT & Family Facts
 Regions Bank Near Me – Branches, ATMs & Hours Guide
 Best Ramen Near Me: Top Spots in Dublin & Health Facts
 When Is Presidents’ Day? 2026 Date + Federal Holiday Facts
 Jean Claude Van Damme: Bio, Movies, Wife, Net Worth
